Understanding your website traffic is key to making informed marketing and business decisions. With so much data available, it can be overwhelming to determine which metrics truly matter and how they connect to your overall goals.
In this post, we walk you through the essential elements to include in your website traffic dashboard, ensuring you capture a holistic view of your site’s engagement, audience, and performance.
1. Overview/Key Metrics
- Total Visits/Sessions: The total number of visits or sessions in a given period.
- Unique Visitors: How many individual users are visiting your site.
- Pageviews: The total number of pages viewed, which helps to see engagement level.
- Average Session Duration: How much time visitors are spending on the site, showing content relevance.
- Bounce Rate: The percentage of users who leave after viewing only one page, indicating potential content or usability issues.
- Pages per Session: The average number of pages a user visits in one session.
2. Traffic Sources
- Channels: Break down traffic sources, such as Organic Search, Direct, Referral, Social, and Paid.
- Top Referral Sources: Identify key external sites driving traffic to your site.
- Social Media Sources: If applicable, a breakdown of traffic from each social platform.
- Paid Advertising: Include metrics for traffic driven by PPC campaigns, such as clicks, impressions, and click-through rates (CTR).
3. Top Landing and Exit Pages
- Top Landing Pages: Which pages users are entering on, showing which content is drawing the most interest.
- Exit Pages: Identify where users most often leave the site, which can indicate pages that need optimization.
4. Audience Insights
- Demographics: Age, gender, and location of your audience, if available.
- Device Breakdown: Desktop, mobile, and tablet traffic, helping to understand user experience across devices.
- New vs. Returning Visitors: Helps gauge how well the site retains users.
5. User Engagement
- Conversion Rate: If the site has goals (e.g., sign-ups, purchases), show the percentage of visitors who completed those goals.
- Goal Completions: Track key actions like form submissions, downloads, or sign-ups.
- User Flow/Behavior Flow: Visualizing user paths can highlight any potential drop-off points or popular journeys.
6. Page Performance Metrics
- Load Time/Page Speed: Highlight any pages with slower load times that could affect user experience.
- Top Content/Pages: Include the most visited pages and any specific performance metrics associated with them.
7. Trends and Comparisons
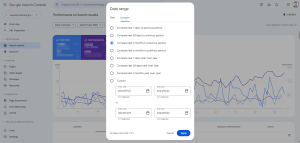
- Time Comparison: Compare data week-over-week, month-over-month, or year-over-year to show growth or areas needing improvement.
- Traffic Trends: Show daily or monthly trends to capture peak times or seasonality.
8. KPIs and Benchmarks
- If your boss has specific KPIs or industry benchmarks, include those as a reference point, so it’s clear how the site is performing relative to goals.
Posts About SEO

Community Building for Brands
How do you make your brand stand out?
The answer lies in the age-old art of storytelling. Just as a perfect ball game keeps fans on the edge of their seats, a well-told story can captivate your audience, create emotional connections, and ultimately drive action.
The following was taken from the book, Three Uses of the Knife: On the Nature and Purpose of Drama, by David Mamet
What do we wish for in the perfect ballgame? Do we wish for our team to take the field and thrash the opposition from the first moment, rolling up a walkover score at the final gun?
No. We wish for a closely fought match that contains many satisfying reversals, but many of which can be seen retroactively to have always tended toward a satisfying and inevitable conclusion.
- Related post: The T-Shirt Theory of Branding
- Related post: The Power of Branding: John’s Family Premium Organic Garlic
- Related post: Why You Don’t Want to Run a Business that Relies Solely on Ads


Continue reading: What’s the ROI of a Billboard


